In the last post, we talked about moving from “smart” cities to “thinking” cities. The idea was simple. Collecting data isn’t enough. Running dashboards isn’t enough. A thinking city understands what it’s looking at and knows what to do next.
Roads are a perfect example of that shift.
Right now, a lot of road analysis systems stop at object detection. They can spot a pothole. They can flag a crack. They can outline a patch. That’s fine as far as it goes. But let’s be honest. Just drawing a box around a pothole doesn’t help a city decide what to fix first, how much it will cost, or whether a full resurfacing makes more sense than another patch job.
If we want a system that can truly analyze road pavement, we need more than detection. We need judgment.
A real pavement management system has to understand every visible surface issue. Longitudinal cracks. Transverse cracks. Alligator cracking. Rutting. Raveling. Patching. Bleeding. Each one matters. Each one has a different weight when you score the road.
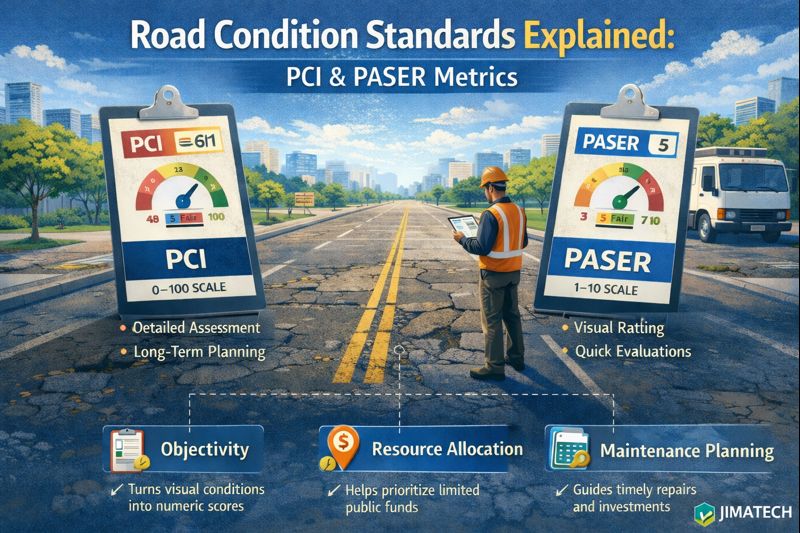
That’s where standards like PCI and PASER come in. The Pavement Condition Index, often called PCI, is built around detailed distress identification, severity levels, and quantity measurements. It’s not just “there’s a crack.” It’s what type of crack, how bad it is, and how much of the surface it covers. All of that rolls up into a score from 0 to 100.
On the other hand, PASER takes a more visual, field-based approach. It groups pavement into condition categories, usually from 1 to 10, based on what a trained inspector sees. Different method, same goal: turn surface conditions into a clear, defensible rating.
If we’re serious about building a thinking system, the model has to speak the language of these standards. It has to classify distresses the way PCI defines them. It has to recognize the visual cues that a PASER rater would use. And it has to assign severity correctly. Low, medium, high. That’s not cosmetic. That drives the math behind the score.
This is where most “AI road inspection” tools fall short. They treat every crack like it’s the same. They count defects but don’t interpret them. That’s a gap.
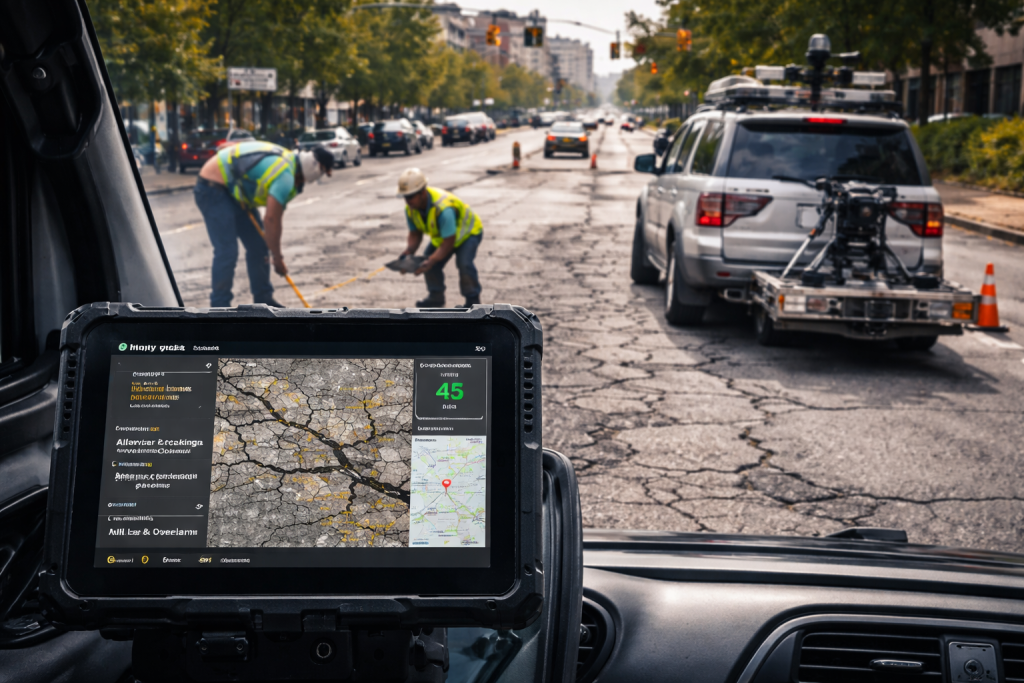
A proper system should start with high-quality image capture. That part is obvious. But after that, the pipeline gets more demanding. The model must segment the pavement area, isolate each distress type, measure its extent, and estimate severity. For PCI, it should calculate deduct values and roll them up into a final index score. For PASER, it should map visual patterns to the correct rating band.
And then it should go one step further. It should recommend action.
Because here’s the thing. A PCI of 55 isn’t just a number. It usually means the road is in “fair” condition and may need preventive maintenance. A PCI of 30 means you’re likely looking at major rehab. A PASER rating of 4 tells a very different story than a rating of 8. Those numbers should trigger treatment logic. Crack sealing. Slurry seal. Mill and overlay. Full reconstruction.
That’s where intelligence shows up. Not in spotting the damage. In connecting the score to a practical, cost-aware recommendation.
But we still haven’t talked about the most overlooked piece: location.
An image without context is only half the story.
If a system detects moderate alligator cracking, that’s useful. But where was that image taken? Is it on a residential side street with low traffic? Is it on a bus route? Is it on a key arterial feeding a hospital or a school? Is it part of a corridor already scheduled for utility work next year?
The position of the camera when that image was captured matters just as much as what the camera saw.
So a serious pavement analysis system has to be location-aware. Every image needs to be tied to GPS coordinates with high accuracy. Ideally, it’s linked to a linear referencing system so it knows the exact segment and chainage. Now we’re not just analyzing pixels. We’re analyzing assets.
When you combine distress detection with spatial data, the system can start making smarter calls. It can cluster defects along a segment and see patterns that a single frame would miss. It can track deterioration over time at the same location. It can compare this year’s PCI with last year’s PCI for the exact same 100-meter stretch.
And that changes everything.
Now you’re not reacting to isolated potholes. You’re managing a network.
Let’s say the system detects moderate cracking in one image. On its own, that might not justify immediate work. But if five adjacent segments show similar patterns and the traffic volume is high, the system might flag the entire corridor for preventive treatment before it slips into expensive failure.
That’s not image analysis. That’s asset management.
A location-based image analysis system can also bring in other data layers. Traffic counts. Functional classification. Climate exposure. Even past maintenance history. When you combine those inputs, the recommendation engine becomes much more grounded in reality.
For example, a low-volume rural road with a PCI of 60 might be left alone for now. A high-volume urban collector with the same PCI might be prioritized for crack sealing this season to slow down deterioration. Same surface condition. Different decision. Because context matters.
This is what we mean when we talk about thinking cities.
The road network isn’t just a collection of pictures. It’s a living system with geography, usage patterns, budget limits, and long-term plans. A smart tool sees defects. A thinking system understands where those defects sit inside the bigger map.
From a technical standpoint, this means integrating computer vision models with GIS platforms. It means building a rules engine that maps PCI or PASER outputs to treatment strategies. It means training models not only on labeled distress images but also on verified inspection reports tied to exact locations.
And it means constant feedback.
When a city applies a treatment, the system should record it. When the road is scanned again, the model should compare predicted condition against observed results. Over time, it should get better at predicting deterioration rates for specific climates and traffic loads.
That’s when you move from static scoring to forecasting.
At that point, you’re not just saying, “This road is at 48.” You’re saying, “At the current rate, this segment will drop below 40 in 18 months. If we apply a surface treatment now, we can extend its life by five years at a fraction of the reconstruction cost.”
That’s real value.
So yes, object detection is part of the stack. It’s the foundation. But it’s not the end goal. A box around a pothole doesn’t help a public works director defend a budget request. A network-level PCI map with ranked treatment options does.
To build a system that truly analyzes road pavement, we need full distress recognition, standards-based scoring, location awareness, and action-driven recommendations. All working together.
Because in the end, it’s not about images. It’s about decisions.
And in a thinking city, decisions are backed by data that understands both what it sees and where it stands.