As of October 2026, institutional desks aren’t asking whether AI matters. But it is whether the money poured into it is out of line with what it earns. That is the same question that was answered, too late, in 2000.
This piece sits under JimaTech’s Financial Sector Solutions focus: Turning Complex Financial Data into Clear Strategic Edge. While the 2026 valuation data look extreme, the leaders are far healthier than the 1999 crowd. The forward multiple on the five largest US tech stocks sits at about 23 times Bloomberg. Howard Marks called that a third of where it stood before the 2000 top. So the task here is to separate signal from noise using dated figures.
What the dot-com bubble was
The dot-com bubble was the late 1990s boom in internet companies. Their share prices climbed far faster than their earnings, or even their revenue. The Nasdaq Composite rose 86% in 1999 alone Goldman Sachs. By early 2000, it had grown to roughly 80% of the value of the New York Stock Exchange (Goldman Sachs). Investors priced these firms on revenue, not profit, because the story was scale and the network, not the balance sheet Investopedia.
The Shiller CAPE ratio reached 44.19 in December 1999, a record on that measure multpl.com. Since it smooths earnings over a full cycle, that number marks where the bubble topped. Also, it is the yardstick that 2026 keeps getting compared to.
How it formed
The mania fed on two engines. First was the flood of initial public offerings. In 1999, 480 US companies raised $61.63 billion in IPOs WilmerHale. Also, 289 of them were internet firms raising $24.66 billion WilmerHale. As a result, the average internet IPO opened about 90% above its price on the first day WilmerHale. Money that might have stayed in a pension fund instead chased the next logo with a dot in its name.
The second engine was the buildout. Carriers poured roughly $500 billion into fiber and telecom gear during the 1990s, well before demand caught up Wikipedia. By July 2002, FCC Chairman Michael Powell told the Senate the industry owed about a trillion dollars, much of which would never be repaid Wikipedia. That is why analysts call it too many highways and not enough traffic PBS NewsHour.
How it burst
The top came first. The Nasdaq peaked at 5,048.62 on March 10, 2000 Wikipedia. Then it reversed hard. On April 14, 2000, the index dropped about 9% in a single day, one of its widest one-day losses at the time Wikipedia.
The S&P 500 had topped at 1,527.46 that same March date. From that peak, it fell about 49%, bottoming in October 2002 Wikipedia. The Dow, which peaked earlier on January 14, 2000, lost about 38% by October 9, 2002 LA Times. The Nasdaq itself slid from 5,048.62 to 1,139.90, down about 78% Wikipedia. Cisco, the networking bellwether, fell about 80% from its peak Wikipedia. After that, the NBER dated the recession from March 2001 to November 2001 NBER.
Who was damaged, and how much went away
The damage spread across nearly every participant. Retail investors who bought the 1999 IPO wave paid first-day prices that never came back Investopedia. In addition, pension funds that held the telecom names took the next round Investopedia.
Workers felt it next. As a result, the high-tech sector lost about 560,000 jobs between January 2001 and December 2002 Wired. The workforce fell about 10% to 5.15 million Wired. Telecom bondholders lost roughly $2 trillion as telecom stocks fell 95% or more Bloomberg. WorldCom filed the largest bankruptcy claim in US history in July 2002 Bloomberg.
The cleanest total is market value. About $5 trillion in US stock market value disappeared between the peak and the trough of the decline Wikipedia. For example, Global Crossing was worth $47 billion in 1999 and never made a profit Wikipedia. So Pets.com, Webvan, Kozmo.com, and eToys all folded Investopedia.
The market in October 2026
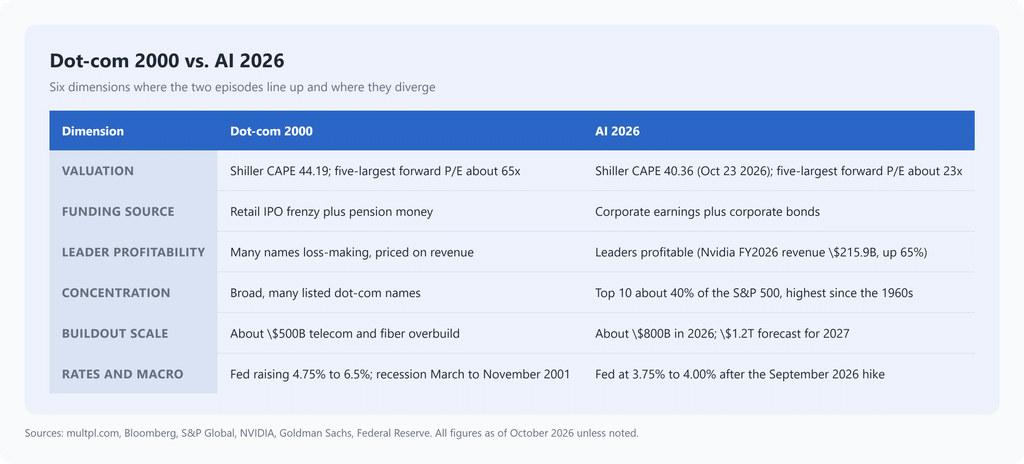
Here is where the comparison gets concrete, because the 2026 figures are dated and checkable. The Shiller CAPE stood at 40.36 on October 23, 2026, just under the 1999 record of 44.19 multpl.com. So that is near the top of the cycle, not far past it.
The S&P 500 set an all-time closing record of 7,818.93 on October 6, 2026 Wikipedia. It closed at 7,623.68 on October 23, 2026 Yahoo Finance.
The buildout is the number that matters most. On September 25, 2026, Goldman Sachs said the five largest hyperscalers will spend about $800 billion on AI Bloomberg. It will then rise to about $1.2 trillion in 2027, Bloomberg. Nvidia, the largest name, reported fiscal 2026 revenue of $215.9 billion, up 65% NVIDIA. Its market cap stood near $5.2 trillion in October 2026 companiesmarketcap.
The credit side is the early-warning channel. In mid-October 2026, the cost of insuring CoreWeave’s five-year debt pushed past 1,140 basis points CNBC. As a result, implied default odds topped 60%, a record for the name Bloomberg. So in a mid-October selloff, chip stocks were down roughly 20% from their June peak CNN Business. Meanwhile, the Fed had just raised rates to 3.75% to 4.00% on September 16, 2026 Chase. That was its first increase since July 2023.
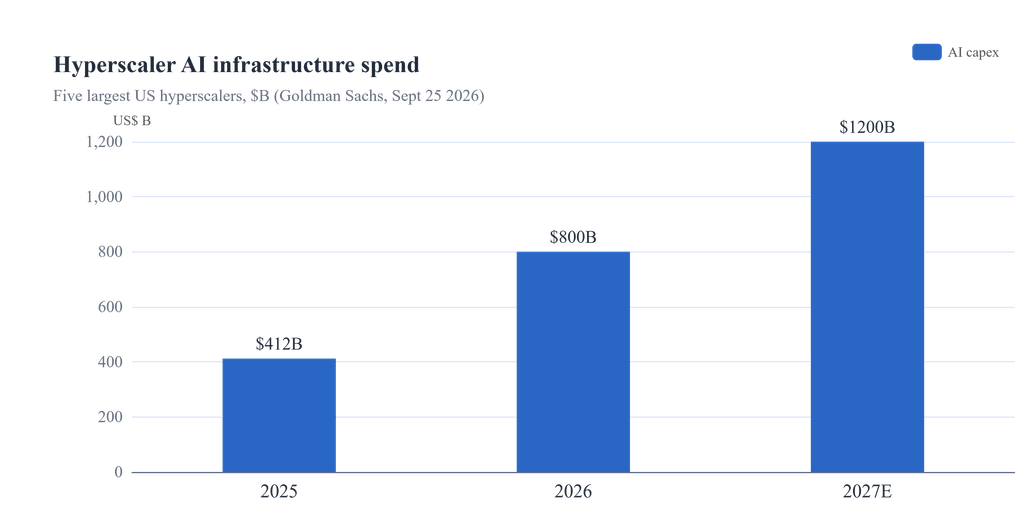
Hyperscaler AI infrastructure spend, 2025 to 2027. The 2025 bar is a derived estimate, and 2027E is a forecast.
Who is warning, and on what date
These warnings are not a fringe view. Ray Dalio told the Forbes CEO conference on October 7, 2026 that an AI bubble could burst, tying it to the path of rates and heavy borrowing by tech firms Forbes. In June 2026, Jeremy Grantham called it the most expensive market in American history CNBC. Michael Burry, for his part, disclosed short positions in 2026, including Nvidia, Oracle, and Vertiv Seeking Alpha. None of these calls is a prediction on timing. But taken together, they mark where the dated skepticism sits.
Where the two episodes line up
Three features are genuinely similar. First, valuation at the top is near record in both cases. The CAPE in 2026 at 40.36 sits just under the 1999 peak of 44.19 multpl.com. Second, both episodes rest on a massive, front-loaded buildout. Carriers bought $500 billion of fiber in the 1990s Wikipedia. Hyperscalers are committing $800 billion in 2026 and $1.2 trillion in 2027 Bloomberg. As a share of the economy, the 2026 buildout is about 2.6% of the $30.77 trillion US GDP, the 2027 forecast about 3.9%, and the 1990s fiber buildout about 5% of the then $10.25 trillion economy World Bank. Third, rates were rising into the mania in both eras. The Fed tightened from 4.75% toward 6.5% in 1999 to 2000 The Guardian. It also hiked again in September 2026 Chase.
Where they differ
The differences are at least as important as the similarities. The leaders in 2026 are profitable, while the ones in 2000 mostly were not. Nvidia alone booked $215.9 billion in revenue in fiscal 2026 NVIDIA. The 1999 internet names, by contrast, were priced on revenue with little profit Investopedia.
Funding also came from a different place. In 2000, the fuel was a retail IPO frenzy and pension money WilmerHale. In 2026, it is corporate earnings and corporate bonds CNBC. So credit, not IPO prices, is the early-warning channel.
Concentration is the sharpest break. In 2000 the index was broad across many dot-com names. In 2026 the ten largest S&P 500 names make up almost 40% of the index, a level last seen in the 1960s S&P Global. That changes what a burst would look like. So a 2026 de-rating concentrates the loss in a handful of positions, rather than a broad, even wash-out.
Side-by-side: 2000 vs 2026
What this means for decision-makers
None of this is a verdict. But the bubble question is about probability, not certainty. The best-dated 2026 data show a market that is expensive and concentrated, yet far more profitable than 2000.
Howard Marks’s point captures the discipline well. So when enough people are already questioning a bubble, the market may behave with restraint rather than repeat 2000, Bloomberg.
For an institutional risk officer, the practical read is this. So treat the CoreWeave-style credit signal as the leading indicator, not the headline index. Watch the forward multiple, about 23x now versus about 65x in 2000 Bloomberg. Watch the concentration of the ten largest names S&P Global. Size positions so a de-rating in the leaders does not concentrate the portfolio. Also stress-test the case where the $1.2 trillion 2027 capex meets a rising rate environment, Bloomberg.
That is the difference between managing the 2026 episode and repeating the 2000 lesson. The readiness test is the same one we apply in our city AI readiness index: is the deployment real, or just the capex? In practice, this is the kind of call that better decision data makes easier. It is the point of JimaTech’s work: a world where data and AI enable better decisions across the systems that serve society.
References
- Wikipedia: Dot-com bubble
- Wikipedia: Stock market downturn of 2002
- Los Angeles Times: The Dow, 50 years
- WilmerHale: 1999, The IPO Report
- Investopedia: Dot-com bubble
- Wikipedia: Telecoms crash
- Wikipedia: Global Crossing
- PBS NewsHour: The Long Fall of Global Crossing
- Wired: Extent of Tech Job Loss Revealed
- Bloomberg: Inside the Telecom Game
- NBER: Business Cycle Dating Committee Announcement
- The Guardian: US economy, Fed rates
- multpl.com: Shiller PE ratio
- Goldman Sachs: 2000, the dot-com bubble
- Bloomberg: Goldman sees hyperscaler AI capex rising 50% to $1.2 trillion
- NVIDIA Newsroom: Q4 and fiscal 2026 results
- companiesmarketcap: Nvidia market cap
- Bloomberg: CoreWeave credit risk hits record as default odds top 60%
- CNBC: CoreWeave credit default swaps hit distress levels
- CNN Business: Global tech selloff deepens
- Chase: Federal Reserve raises rates
- Wikipedia: Closing milestones of the S&P 500
- Yahoo Finance: S&P 500 historical data
- S&P Global: In the shadows of giants
- Bloomberg: Howard Marks, bubble and valuations
- Forbes: Ray Dalio warns AI bubble could soon burst
- CNBC: Jeremy Grantham, most expensive market in American history
- Seeking Alpha: Burry short positions in Nvidia, Oracle, and Vertiv
- World Bank: GDP current US dollars (US)